This analysis method is for standard and keno games only. For Pick games this will be an equivalent for vertical lines.
In this analysis you can see how numbers are drawn from each group
For example, when we have numbers like this:
10 13 23 26 35 47
In this sample lottery draw we have numbers that were drawn from 5 different groups;
Number 10 was drawn from Group 0 ( 10 20 30 40 )
Number 13 and number 23 was drawn from Group 3 ( 3 13 23 33 43 )
Number 26 was drawn from Group 6 ( 6 16 26 36 46 )
Number 35 was drawn from Group 5 ( 5 15 25 35 45 )
Number 47 was drawn from Group 7 ( 7 17 27 37 47 )
To see the analysis from how many groups lottery numbers are drawn, select from menu Grouped Numbers / Similar Numbers Group > Distribution of Similar Numbers
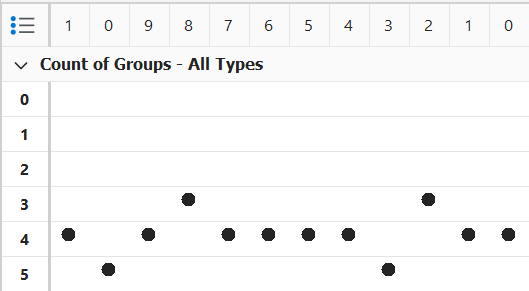
As you can see in our sample game 6/49 the most common count of groups is from 3 to 6 groups.
It is really not worth to select numbers that comes from 2 groups only because numbers are rarely drawn in that way.
For example if you pick numbers like that:
10 12 30 22 32 40
then you have picked numbers form 2 groups only:
Numbers 10 and 30 were picked from Group 0 ( 10 20 30 40 )
Numbers 12 and 22 were picked from Group 2 ( 2 12 22 32 42 )
In this analysis method the Number Type Switch is disabled and only one diagram is shown.
Please see also Analysis Screen topic for more info on how to interpret diagrams