The last game’s numbers and their arrangement on the Game Layout View serve as the essential visual foundation for predicting the numbers in the next draw. Each draw creates a snapshot of patterns, showing how numbers aligned across horizontal lines, vertical lines, diagonal streaks, blocks, and groups.
By overlaying the newly drawn numbers onto the previous Game Layout View, players can clearly see the relationships, connections, and transitions between past and present results. This comparison highlights whether numbers are appearing in clusters, repeating positions, mirrored placements, or adjacent sequences.
Such visual overlays make it possible to analyze not just the drawn numbers themselves, but also their distribution across the ticket grid—whether concentrated in one area or evenly spread. Players can track how lines, blocks, and groups evolve from one draw to the next, revealing tendencies such as numbers following each other, groups appearing after other groups, or streaks continuing across multiple draws.
This process transforms lottery analysis from raw number crunching into visual storytelling, where the Game Layout View becomes a map of probability and trends. When combined with filters and wheel system ticket generation, it provides a powerful decision-making tool for choosing numbers that align with observable past-to-present transitions.
The Ticket Number is a one number from a game numbers pool like from example one of numbers from 1 to 49.
The Draw Number is one number out of all the drawn numbers, like 1 from 6.
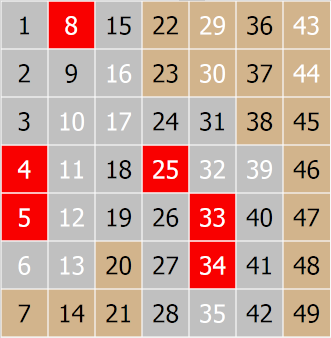
Here below in the sample picture of a game's Game Layout View, our base view.
Each ticket number, by its nature has already couple of types of numbers assigned, each ticket number also belongs to few of game layout elements.
For example, ticket number 1
Is a cold,odd,contact,in horizontal line 1, in vertical line 1, belong to Groups of Similar Numbers 1 etc
In other grid view is also a connected number.
And, also for example, ticket number 30
Is a hot,even,outside,in horizontal line 2, in vertical line 5, belong to Groups of Similar Numbers 0 etc
In other grid view is also an unconnected number.
When the new numbers are drawn 4,19,21,23,32,38 we put them on Game Layout View (new numbers has a blue borders)
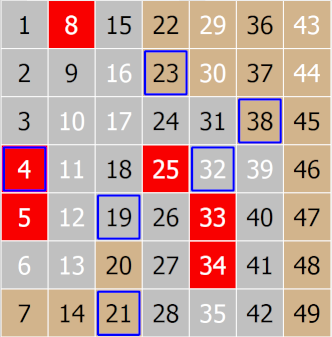
Any new number put on the Game Layout View relates in many ways to the previous numbers or game layout, and we analyze those relations.
So for example, take a look on a new drawn number 19
Number 19 was drawn as a contact number, because is within a pool of game contact numbers
Also is drawn as cold numbers, because is within a pool of game cold numbers, odd, unconnected, in horizontal line 5, in vertical line 9, belongs to Groups of Similar Numbers 9 etc
Finally, the new numbers 4, 19, 21, 23, 32, and 38 became the new foundation for analyzing and predicting the next lottery draw.
We,repeat these observations, The last game numbers and theirs view on the game's Game Layout View, is the visual base for prediction of the next numbers.
We put the new drawn numbers over the last Game Layout View and observe how they relate and how they are distributed over the ticket.
Here below in the sample picture of a game's lottery draw Game Layout View, our base view to analyze.
Each number of the ticket has already couple of types of numbers assigned, each number also belongs to couple of game layout elements.
For example, ticket number 1
Is a cold,odd,contact,in horizontal line 1, in vertical line 1, belong to Groups of Similar Numbers 1 etc
In other grid view is also a connected number.
In another example, ticket number 30
Is a hot,even,outside,in horizontal line 2, in vertical line 5, belong to Groups of Similar Numbers 0 etc
In other grid view is also an unconnected number.
When the new numbers are drawn 4,19,21,23,32,38 we put them on Game Layout View (new numbers has a blue borders)
So, we can see that
Number 4 was drawn as contact, hot, even, connected, in horizontal line 4, in vertical line 1, belongs to Groups of Similar Numbers 4 etc
Number 19 was drawn as contact, cold, odd, unconnected, in horizontal line 5, in vertical line 9, belongs to Groups of Similar Numbers 9 etc
Number 21 was drawn as outside, cold, odd, disconnected, in horizontal line 7, in vertical line 9, belongs to Groups of Similar Numbers 1 etc
And so on..
Finally, the new numbers 4,19,21,23,32,38 became a new base for another lottery draw.
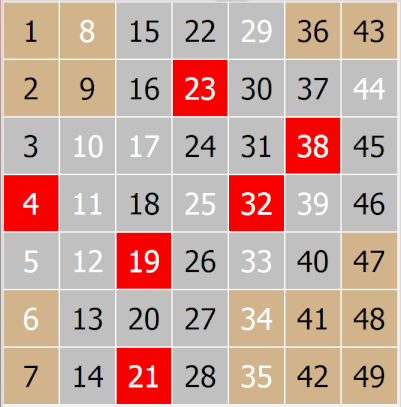
We, repeat that observations, and see what is the pattern of occurrences of numbers in all game lottery drawings is.
The ticket numbers are changing their types from lottery draw to lottery draw.
For example number 1 in previous lottery draw was a contact number and now is an outside number etc
Using Visual Analyser we can observe the patterns on diagrams.
The ticket numbers are changing their types from lottery draw to lottery draw.
For example, number 1 in previous lottery draw was a contact number and now is an outside number etc
Using Visual Analyser we can observe the patterns on diagrams.