This program introduces an innovative approach to visualizing lottery games: Game Layout View.
Game Layout View provides a dynamic graphical representation of both the game's number distribution and its overall structure, offering deeper insight into the lottery’s layout.
Visual Lottery Analyser offers a revolutionary approach to lottery number analysis by combining visualization techniques, statistical filters, and advanced wheel systems. Instead of reading thousands of rows of past draws, players can now see patterns, trends, and streaks at a glance, making complex lottery data immediately understandable.
The software organizes lottery numbers into game layout views, including horizontal lines, vertical lines, diagonal lines (right and left), and sequential number blocks. This allows players to study distribution patterns across the ticket grid, such as whether numbers cluster in specific rows, columns, or diagonals, and how numbers spread across low and high blocks or 10-number sequential blocks.
Numbers can also be analyzed based on occurrences, repetitions, mirrored numbers, adjacent placement, groups with identical end digits, or patterns after specific numbers or groups. The software tracks how often numbers reappear across historical draws, enabling detection of frequently drawn numbers, “cold” numbers, and recurring sequences.
Filters in the software allow precise control over ticket generation and wheel system combinations. Players can set conditions such as quantity of numbers in a block, occurrences in lines, repetitions in past draws, or group-based sequences, and choose whether these combinations should be accepted or rejected during ticket generation.
By combining visual analysis with mathematical filters, players can refine their number selection, remove statistically weak combinations, and design tickets and wheels that align with observed trends and patterns. The result is faster, more informed lottery analysis, reducing noise and increasing focus on numbers and combinations that match the player’s strategy.
This approach works across all supported lottery games, including standard lotto games, Pick games, and Keno, and is especially powerful for games like 6/49, where the number of possible combinations is enormous. By visualizing numbers in lines, blocks, and groups, players can quickly grasp recurring structures, streaks, and anomalies that are otherwise invisible in raw data..
Let's review a sample lottery game like Lotto 6/49 where 6 numbers are drawn from 49 numbers.
Game Layout
Traditional way
Usually, we think about a game as a group of numbers, well there are 49 numbers:
1 2 3 4 5 6 7 8 9 10 11 12 13 14 15 16 17 18 19 20 21 22 23 24 25 26 27 28 29 30 31 32 33 34 35 36 37 38 39 40 41 42 43 44 45 46 47 48 49
New way
We can see a game as square field of numbers.
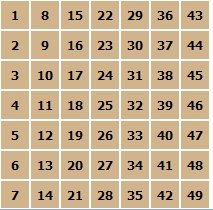
Lottery Numbers (lottery drawings)
Traditional way
In our sample game there are six numbers drawn, so for example we have game numbers such as:
5 6 9 15 38 41
New way
We can place them on our Game Layout View and colorize them. Looks better!
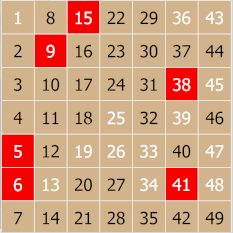
The terminology we will use is:
The Ticket Number is a one number from a game numbers pool like from example one of numbers from 1 to 49.
The Draw Number is one number out of all the drawn numbers, like 1 from 6.
New Lottery Numbers (lottery drawings)
Traditional way
How to see how the new game numbers are in relation to the previous ones?
1 11 23 28 30 41 - New ones
6 10 16 32 34 44 - The previous numbers
Also, not much to say about their relations.
New way
We can place new numbers on top of the old ones and colorize them.
We use blue borders to show the new numbers.
2 11 23 31 38 41 - New ones (blue border)
7 12 19 31 36 39 - The previous numbers (red ones)
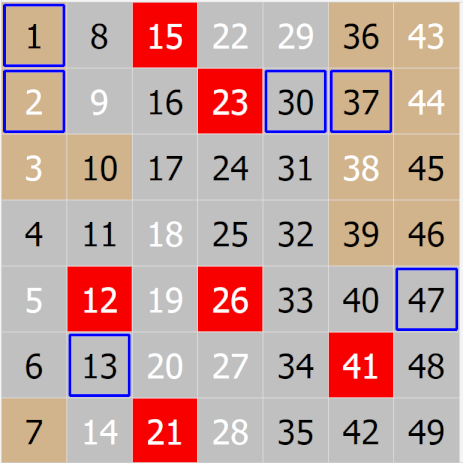
In the old-fashioned way, you will not be able tell much about number's relations, in a new way you can tell how the new numbers are relating to the previous ones just by taking look on a Game Layout View
There are more things to discover, and this is just the beginning.
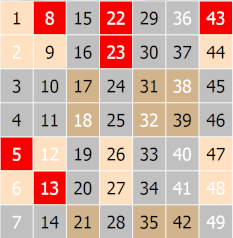
Here is the Game Layout View showing all Contact & Outside Numbers, Hot & Cold Numbers and Odd & Even Numbers
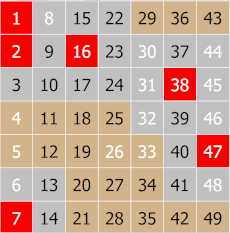
Game numbers - red
Contact numbers - gray
Outside numbers - brown
Hot numbers - white numbers
Cold numbers - black numbers
Here is the Game Layout View showing all Connected & Unconnected and Disconnected Numbers
Game numbers - red
Connected numbers - pink
Unconnected numbers - gray
Disconnected numbers - brown
You can change the ticket colors in software options.