Visual Lottery analysis involves using data visualization techniques to analyze lottery data and gain insights into patterns, trends, and probabilities related to lottery numbers and outcomes.
Visual Lottery Analyser introduces a new revolutionary approach to analyze lottery games.
A visual presentation of numbers!
One peek at a diagram gives you much more information than many lines of lottery numbers.
Diagrams let you analyze lottery games with greater speed and better understanding.
You can see the numbers pattern and make a prediction of how the numbers may probably occur in the future.
The Old Way - Example 1
Let's try to analyze number 1 and number 2, how often these numbers have been drawn in the past lottery drawings?
If not been drawn then we can write 0, if yes then we can write 1, in the result we receive:
Number 1: 0,0,1,1,0,1,0,0,0,0,0,1,0,0,1
Number 2: 0,1,1,0,1,0,0,0,0,0,0,0,1,1,0
All that above is not very readable, do you agree?. And how fast you can draw some conclusion based on such bunch of numbers?
The New Way - Example 1
Here below is a screenshot of Visual Analyser's window (just a small part of it) with analysis of some game numbers.
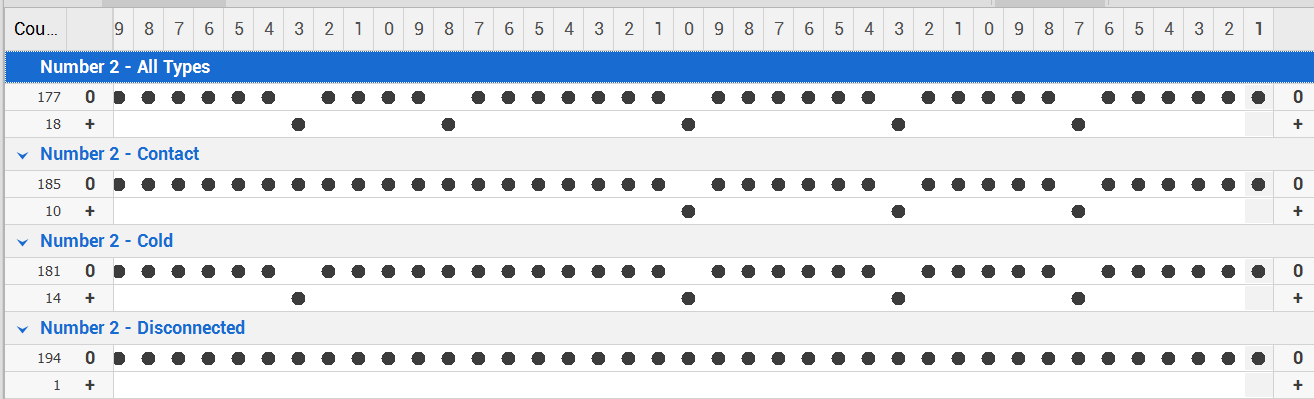
These are graphical diagrams. How do you read it? You might have already figured it out.
When the analyzed number is not drawn, a black point is shown in the row (0).
When the analyzed number is drawn, a black point is displayed in the row (+).
It’s simple! Now you can see the series of analyzed numbers as a wave of points, where each point represents a single number occurrence.
When you looking at the diagram, look from the diagram left to its right side. From older to newest drawing
This creates a wave of occurrences (black dots) which is easy to interpret with just taking a look on the diagram
The Old Way - Example 2
Let's analyze a group of game numbers to see how frequently they've been drawn in past lottery drawings.
If a number hasn't been drawn, we record it as 0. If it has, we note the quantity of times it was drawn.
This way, we create a record like this:
0,2,1,1,0,1,0,0,0,3,0,1,0,0,1
Also, such string of numbers does not say much and is hard to make any fast prediction.
The New Way - Example 2
While the diagrams above illustrates a simple fact whether a number has occurred or not.
We can analyze occurrences of numbers in whole group of numbers line, numbers from lines, blocks etc
Here below is a screenshot of Visual Analyser window (just a small part of it) with results of analysis of numbers from horizontal line 1.
For example, analyzed line is the first horizontal line of a game.
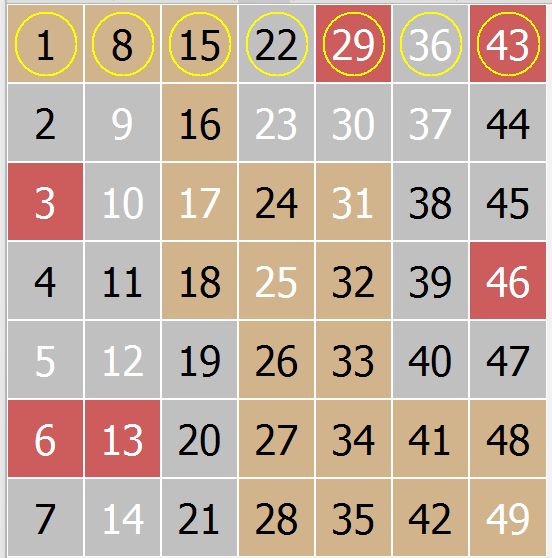
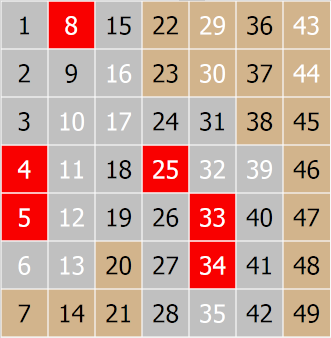
In our example the horizontal Line 1 has the following numbers: 1,8,15,22,29,43.
See, on the the Game Layout View picture below, the numbers of the line circled in yellow
How to interpret the diagram?
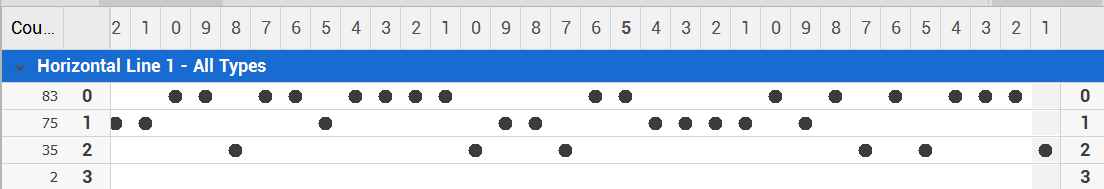
When no number is drawn from the analyzed group, the point is placed in row (0).
When one number is drawn from the analyzed group, the point is placed in row (1).
When two numbers are drawn from the analyzed group, the point is placed in row (2), and so on..
The diagram indicates that from analyzed group of numbers two numbers were drawn during the last draw : 29 and 43 were drawn.
On the left side of the diagram, under the column "Count," you can see the total number of times each number occurred.
In our sample diagram, it shows that in row 3, only two instances of three numbers were drawn.
How to predict what would happen in the future lottery draw?
One might speculate that the point could land on row 0, with no numbers being drawn from that row, or possibly on row 1.
Points on row 2 appear occasionally but rarely repeat after a single occurrence.
Therefore, there is a high probability that two numbers from the horizontal line (1) 1, 8, 15, 22, 29 will not be drawn in the next lottery draw.
More diagram interpretations
The situation isn't always as clear as in the examples above.
It all depends on the game layout and the number of game numbers drawn, as these factors vary from one lottery draw to another.
How can the diagram be interpreted to draw logical conclusions when it looks like that
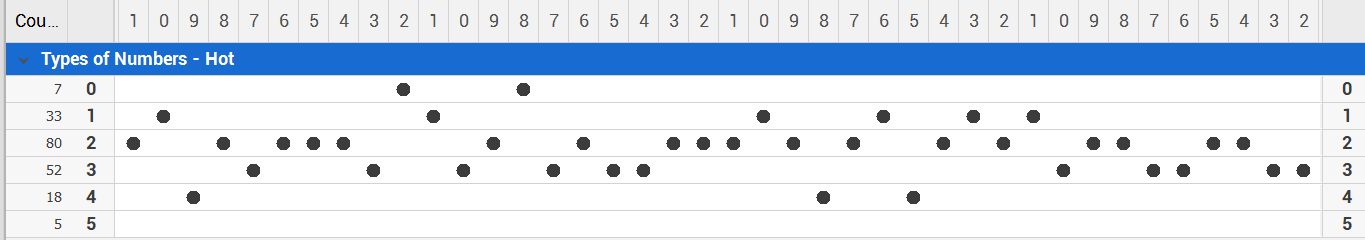
Above is a screenshot of Visual Analyser window (just a small part of it) with results of analysis of occurrences of Hot numbers in a game.
On a Game Layout View the Hot numbers are shown in white
Firstly, it is evident that all past lottery drawings typically include some of the hot numbers, with points rarely appearing in row 0.
In this example, there is also no point at row 5. This is crucial information, as it shows that hot numbers are almost always drawn in this game.
Furthermore, the majority of draws fall within the range of 2 to 3 numbers.
If you purchase a lottery ticket without any hot numbers, you significantly reduce your chances of hitting the jackpot.
Summary
With diagrams, Visual Lottery Analyser allows you to study various numbers, lines, blocks, and groups of numbers.
You can analyze any type of game numbers either individually or in combination.
To discover all these features, just launch the software and see for yourself.
Visual Analyser offers numerous analyzing methods, each featuring several diagrams. Overall, there are hundreds of diagrams to explore, but you can choose to use only a few of them it’s entirely up to you.
By reviewing all of them or just few chosen, you can get a general idea of the future lottery draw, predicting which numbers are more likely to be drawn and which are less likely. To better track your conclusions while analyzing these diagrams, you can utilize the built-in My Choices tool.
Using this feature to select numbers can be quite time-consuming. However, with our busy lives today, it's worth remembering that Visual Lottery Analyser is computer software designed to handle the entire process for you in just seconds.
You can use All-in-One Analysis or Tickets Advanced to create numbers that will match analysis criteria, fast and easy.